Selected projects
Supervised learning algorithms
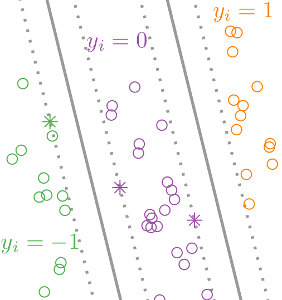 |
We proposed a Support Vector Machine (SVM) algorithm for learning ranking and comparison functions, given training data which consist of labeled pairs of input features. We apply the algorithm to learning to rank chess players based on historical game outcomes (Figure: win y=1, lose y=-1, draw y=0). We show that the model can be efficiently computed using existing binary SVM solvers. Pre-print: arXiv:1401.8008. R package: rankSVMcompare. |
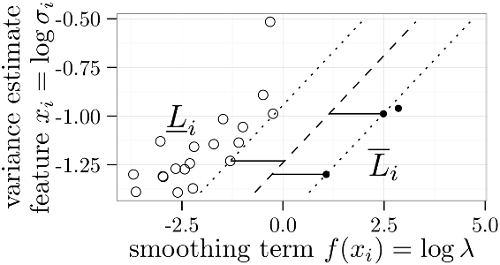 |
We proposed a linear regression algorithm for data with censored labels, based on minimizing a convex cost function. The main novelty with respect to previous formulations for censored regression is the idea of maximizing the margin – the best regression function should be as far away as possible from the nearest interval limits (black and white dots in the figure to the left). ICML’13 paper, useR2017 tutorial, R package penaltyLearning. |
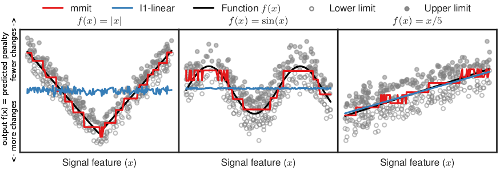 |
We proposed Max Margin Interval Trees, a non-linear decision tree algorithm for regression in data with censored labels. The figure to the left shows the non-linear function learned by our algorithm in red, which closely approximates the true function in black (the baseline linear function in blue only works well when the data have a linear pattern). Paper: NeurIPS’17. R package and python module: mmit. |
New labeling methods and supervised learning problems
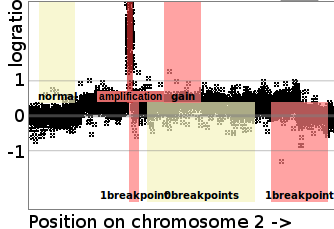 |
We proposed the SegAnnDB system for interactive machine learning analysis of DNA copy number profile data. SegAnnDB makes it easy for genomic researchers to interactively label their data sets with breakpoint and copy number annotations (colored rectangles in figure to the left). These annotations are stored in a web database and used to compute machine learning segmentation models that are used for highly accurate prediction of breakpoint and copy number alterations, which are important for diagnosing cancers such as neuroblastoma. We used the system to create labeled benchmark data sets such as R package neuroblastoma. Paper: Bioinformatics (2014), Software. |
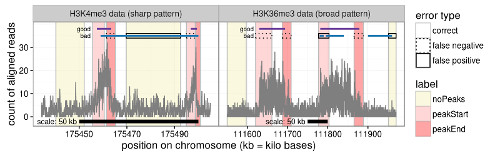 |
We proposed a labeling method and supervised machine learning approach for peak detection in epigenomic data such as ChIP-seq and ATAC-seq. As shown in the figure to the left, labels (colored rectangles) are used to indicate presence/absence of peaks in specific samples and genomic regions. This labeling method works with epigenomic data with different peak patterns, such as sharp peak data (left figure) and broad peak data (right figure). We created several data sets with labels and published them as a benchmark on the web. Paper: Bioinformatics (2017). R package for computing the error of a peak model with respect to the labels: PeakError. |
Unsupervised learning algorithms
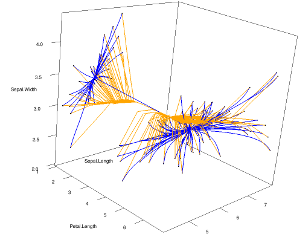 |
Clusterpath is a clustering algorithm based on minimizing a convex cost function which consists of a loss function (for data fitting) and a fusion penalty (to encourage few clusters). Our ICML’11 is highly influential with over 200 citations as of 2021. The figure to the left shows the path of solutions for two different versions of the algorithm, L1-norm penalty in orange, and L2-norm penalty in blue, as computed and visualized using our R package with C++ code. |
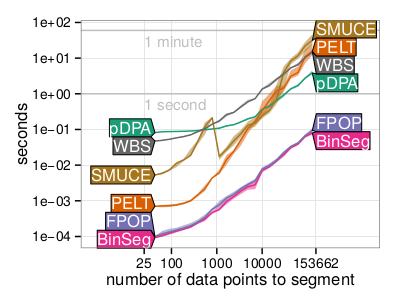 |
We proposed the Functional Pruning Optimal Partitioning (FPOP) algorithm which performs changepoint detection in sequential data by minimizing a cost function that consists of a convex loss (for data fitting) and a non-convex penalty on the number of changepoints. Although non-convex problems are typically intractable, our FPOP algorithm exploits the structure of the cost function in order to compute the globally optimal solution in log-linear time. The figure to the left shows that FPOP is just as fast as the binary segmentation heuristic algorithm, and much faster than other changepoint algorithms. Paper: Statistics and Computing (2016). R package fpop. |
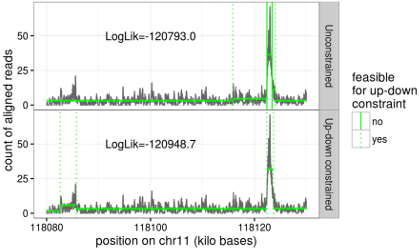 |
The PeakSeg algorithms perform changepoint detection by minimizing a cost function which consists of a convex loss function (for data fitting), a non-convex penalty on the number of changepoints (to encourage few segments/changepoints), and an up-down constraint on adjacent segment mean values. We have proposed efficient log-linear dynamic programming algorithms which compute the globally optimal model, subject to the constraint that up changes must be followed by down changes, and vice versa. This ensures that the model can be interpreted in terms of peaks (after up changes) and background (after down changes), which is important when analyzing genomic data such as ChIP-seq and ATAC-seq. The figure to the left shows the difference between the unconstrained (top) and up-down constrained (bottom) models. Papers: Journal of Machine Learning Research (2020), arXiv:1810.00117. R packages: PeakSegOptimal, PeakSegDisk. |
Data visualization
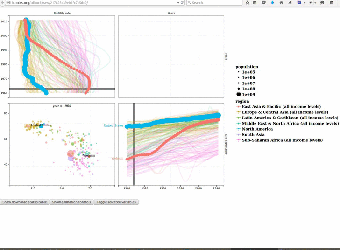 |
We use interactive data visualizations to explain complex machine learning models. Since interactive graphics are usually difficult and time-consuming to create, we proposed an interactive grammar of graphics which makes creating such interactive graphics much easier. We created the animint R package and presented it during a useR2016 tutorial on interactive graphics. Paper: Journal of Computational and Graphical Statistics (2018). User manual with example data visualizations of machine learning models: Nearest neighbors, Lasso, SVM, Changepoint detection, Poisson regression. |
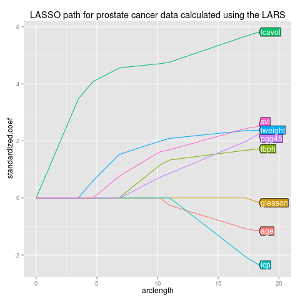 |
Creating informative and readable figures is important in any field of research. We proposed an R package that makes it easy to add labels directly on the relevant curves in multi-color plots, which is often easier to read than a legend. R package directlabels won Best Student Poster at useR 2011. |